How to calculate the percentage of a selected group of customers in Power BI
Colin Maitland, 12 April 2023
In this article, I will demonstrate how to calculate the percentage of the total for selected Customers versus the percentage of the total for all Customers.
For example, I want to use a slicer to select the Top 10 Customers and for each of those display what percent the Actual Revenue is compared with the total Actual Revenue for the selected Customers and for all Customers.
In this example, the % GT (Selected) column displays what the Actual Revenue is as a percentage of the total Actual Revenue for all selected Customers. The % GT (All) column displays what the Actual Revenue is as a percentage of the total Actual Revenue for all Customers. GT stands for Grand Total.
Top X Customers
In this example, the Top X Customers are selected using a slicer and a corresponding measure is used to filter the table to only display the Top X Customers. I demonstrate this in my article titled “How to configure a Top X Slicer in Power BI”.
Actual Revenue
The following image shows the Actual Revenue measure. The details of this measure are not important for the purposes of this article. This measure could be any measure that you have written yourself. What is important, however, is how to calculate the percentage values based on this measure.
% GT (Selected)
% GT (Selected) is a measure that calculates the Actual Revenue for each Customer as a percent of the total for all selected Customers. Here are two methods for adding this calculation to your report.
1. The first method is to let Power BI write the calculation for you. This approach results in the calculation being added to your visualisation, but it does not result in any new measure being added to your data model.
1.1. add the Actual Revenue measure as a column to the Power BI visualisation
1.2. select “Show value as Percent of grand total” from the drop-down menu for the Actual Revenue column. The calculation will be changed, and the column will be renamed to %GT Actual Revenue.
1.3. optionally rename the %GT Actual Revenue column to something else such as % GT (Selected)
1.4. optionally format the %GT (Selected) column to display the required number of decimal places
2. The second method is to add a new measure to your data model.
I have written this measure using the DAX ALLSELECTED() function.
This measure divides the Actual Revenue for each Customer row with the total Actual Revenue for all Customer rows selected by the visualisation.
The key to this calculation is the use of the ALLSELECTED() function to include all the selected Customers when calculating the total Actual Revenue. However, be aware that this is a very complex function to understand! It must be used carefully! You can learn all about this function here: “The definitive guide to ALLSELECTED”.
% GT (All)
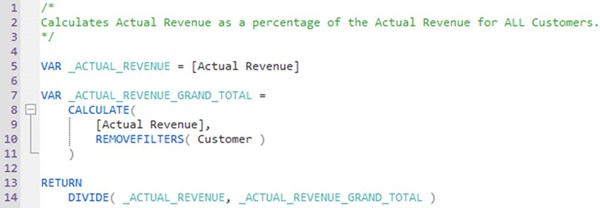
% GT (All) is a measure that calculates the Actual Revenue as a percentage of the total for all Customers, not just those selected by the visualisation. I have written this measure using the DAX REMOVEFILTERS() function to remove all Customer filters when calculating the total Actual Revenue.
I could also write this measure as follows where the REMOVEFILTERS() function is configured to only remove the Customer Name filter from Customer. In this example, Name (Customer) is the name of the Customer Name column in my data model.
Segmenting by Country
These are the results when segmenting the Customers by Country. Here the percentages are still calculated against the Grand Total of the Customers not taking into consideration the segmentation by Country.
However, the measures can be rewritten as shown below.
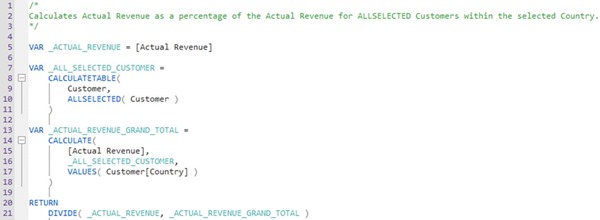
In the following example, I have modified the %GT (Selected) measure to use two filters when calculating the total Actual Revenue for all selected Customers. The first filter is a table of all selected Customers generated using ALLSELECTED( Customer ) and the second filter is a table of the Customer Countries generated using VALUES( Customer[Country] ). Here, the ALLSELECTED() function is invoked in a separate step otherwise incorrect results would be calculated.
In the following example, I have modified the %GT (All) measure to use ALLEXCEPT() instead of REMOVEFILTERS() to remove all filters except any on the Customer Country when calculating the total Actual Revenue for all Customers.
The previously mentioned modification using REMOVEFILTERS( Customer[Name (Customer)] ) instead of REMOVEFILTERS( Customer ) would also work because only the filter on Customer Name rather than all filters on the Customer is removed. This leaves the Customer Country filter intact. The approach you use will depend on your usage scenarios.
As a result of these modifications, the visualisation now displays these percentages which are segmented by Country.
Conclusion
The ability to calculate a percentage of the Grand Total for either all Customers or only selected Customers is an important skill when writing such formulas using DAX. In this article, I have demonstrated how to do this using DAX functions such as ALLSELECTED() and REMOVEFILTERS(). The approaches demonstrated in this article can be adjusted to your own scenarios and used as a pattern.


