Creating/Replacing Marketing Lists in Dynamics 365 from Power BI - Part 2
Colin Maitland, 26 November 2020
In my first article of this series, I introduced a demonstration of a custom Canvas App, named ‘Marketing List App’, that is used to create new or replace existing static Marketing Lists in Dynamics 365 populated with a list of Supporters selected in a Power BI report.
In this article I will demonstrate the first of some possible approaches that may be used for making the list of Supporters selected in the Power BI report available to the embedded Canvas App.
Power BI Power Apps for Power BI Visualisation
The first approach is to use the ‘PowerApps for Power BI’ visualisation. This is the most straight forward approach to use. However, this approach has a limitation in that it only allows you to transfer a maximum of 1,000 records from a Power BI report to a Canvas App.
This ‘PowerApps for Power BI’ visualisation in Power BI allows you to add a Canvas App to a Power BI report and to configure what columns for selected records in the report are to be transferred to the app. The configuration requires a few simple steps to implement. A step-by-step guide is available here.
It is important to know that the steps for adding a Canvas App to a Power BI report should be completed by editing the report in Power BI Online rather than from Power BI Desktop. You can then optionally download the report and edit the report in Power BI Desktop.
In my example, the columns that are selected to be passed from my Marketing List App Power BI report to my Marketing List App Canvas App are the CustomerKey and EntityTypeCode columns from a table named Giving Summary. The CustomerKey is the unique Dynamics 365 AccountId or ContactId for each selected Supporter and the EntityTypeCode is 1 if the Supporter is an Organisation, i.e. an Account, or 2 if the Supporter is an Individual, i.e. a Contact. These two columns are all that the Marketing List App needs in order to know which Supporters are to be added as Marketing List Members to any new or replaced static Marketing List for Individuals or Organisations in Dynamics 365. The following image shows this configuration on the ‘PowerApps for Power BI’ visualisation in Power BI.
It is important to ensure that any filters applied to the list of selected Supporters in the report are also applied to the ‘PowerApps for Power BI’ visualisation, especially if the filters are applied using Slicers that appear on a different page to that on which the Canvas App has been added. In my example I have used a combination of locked and user configurable Report Level Filters and hidden synchronised Slicers. The Report Level Filters apply to all pages in the report and the Slicers that appear on other pages of the report have hidden synchronised counterparts on the page of the report that displays the Marketing List App.
When adding the ‘PowerApps for Power BI’ visualisation to a report, a component named ‘PowerBIIntegration’ is automatically added to the selected Canvas App. This component contains a Refresh() method and a Data table.
The ‘PowerBIIntegration’.Refresh() function when invoked from the Canvas App will refresh the report but only if the report uses Direct Query to connect to its data source. This method can be invoked after the Canvas App has been used to add or edit records that are then to be refreshed in the report. It is important to be aware of the fact that if you want to use the ‘PowerBIIntegration’.Refresh() function in a Canvas App, you should select the ‘Create new’ rather than the ‘Choose app’ option as you follow the configuration steps for the PowerApp for Power BI visualisation, otherwise this function will not be available for use in the Canvas App.
The ‘PowerBIIntegration’.Data table contains the records that have been transferred from the Power BI report to the Canvas App. This may be used as a data source for Collections and Controls, such as Galleries and Forms. It may also be used in Formulas.
In this example, you can see that the ‘PowerBIIntegration’.Data table has two columns. These are the previously added CustomerKey and EntityTypeCode columns from the Power BI report.
Here is an example of a formula in the Canvas App that counts all the Supporters, those Supporters that are Organisations and those Supporters that are Individuals in ‘PowerBIIntegration’.Data and then assign the results to corresponding Context Variables:
In my ‘Marketing List App’, these counts are then displayed in a message at the top of the screen. The total number of Supporters counted is 1,000.
As previously mentioned, there is a limitation with how many records are transferred from a Power BI report to a Canvas App using the ‘PowerApps for Power BI’ visualisation; that is, only the first 1,000 selected records. In this example, the number of Supporters selected in Power BI was many thousands. Therefore, this approach cannot be used if you want to access more than 1,000 records from a Power BI report to a Canvas App.
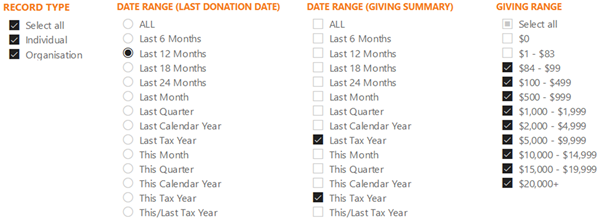
For my ‘Marketing List App’, I want the ability to pass many thousands of Supporters from the Power BI report to the Canvas App based on selections made in the Power BI report using Slicers such as those shown here.
Canvas Apps has an Advanced Setting that affects how many records can be queried by a Canvas App when using a delegable data-source. However, use of this setting is not applicable when using the PowerBIDataIntegration.
In my next article, I will review another approach that might be considered for transferring records from a Power BI report to a Canvas App.


