Microsoft Announces PPCC 2026: A Bigger Power Platform Community Experience

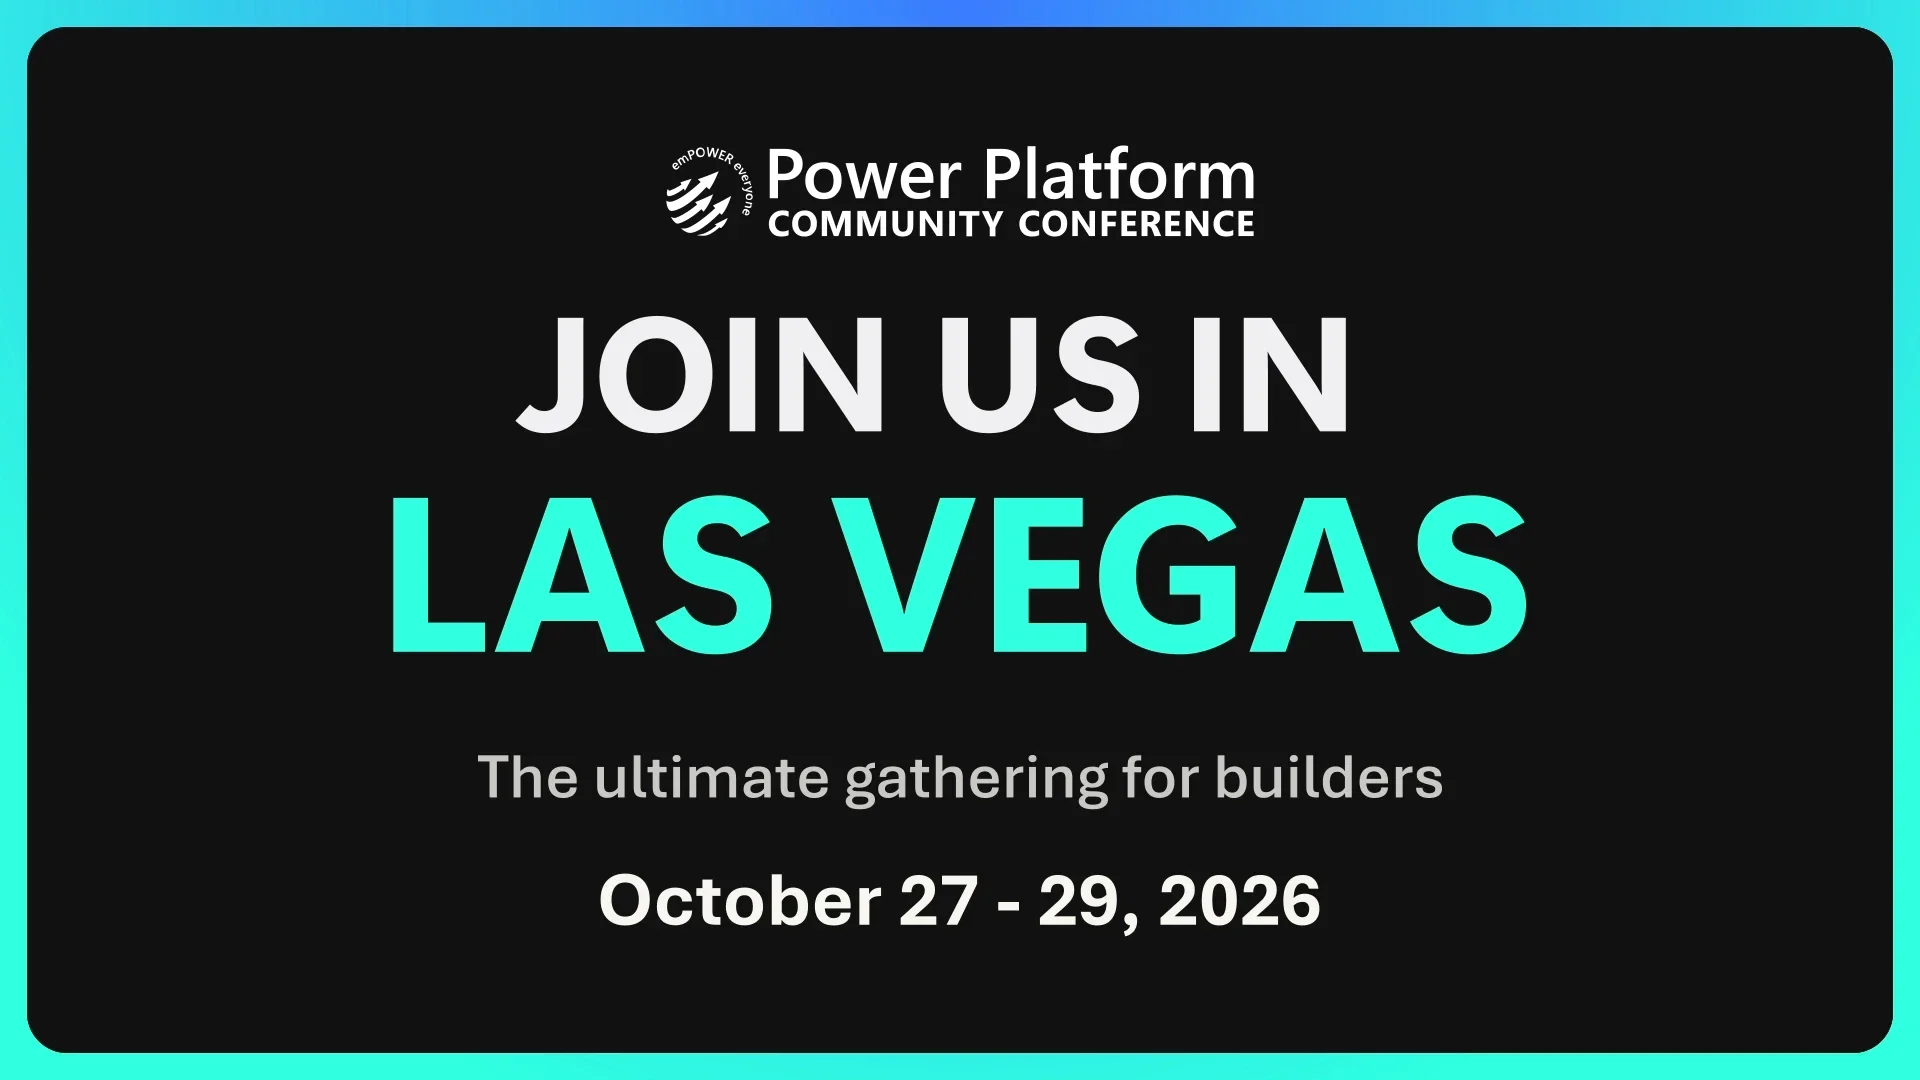
The Power Platform Community Conference (PPCC) is returning for its fifth annual event, bringing solution makers from around the world together from October 27–29, 2026, in Las Vegas. This year’s conference will focus on the latest developments across Microsoft Power Platform, AI, agents, apps, automation, and data, while creating opportunities for attendees to learn directly from Microsoft experts and the community.
Here’s what you need to know:

  • Discover What’s Next for Power Platform

    PPCC 2026 will feature 200+ sessions, dozens of hands-on workshops, three days of keynotes, onsite AI and agent certification opportunities, and a global community focused on what’s next with AI. Dive into Copilot, Copilot Studio, Power Apps, Power Automate, Power BI, Power Pages, and Dataverse while learning how agents, apps, workflows, automation, and trusted data can come together as complete business solutions.

  • Hear from the Experts Shaping the Platform

    The conference opens with Charles Lamanna, Executive Vice President at Microsoft, sharing a forward-looking perspective on Copilot, agents, and the future of the platform. You’ll also hear from Microsoft product leaders such as Ryan Cunningham, Corporate Vice President of Copilot Studio & Power Platform, alongside engineers, product managers, enterprise practitioners, MVPs, and community experts.

  • Take AI from Ideas to Real-World Solutions

    Explore how solution development is evolving through sessions covering Copilot-first app design, multi-agent systems, AI evaluation and governance, intelligent automation, enterprise architecture, and adoption. PPCC will show how organisations can move beyond isolated AI experiments and build secure, scalable solutions that connect people, processes, applications, automation, and trusted data.

  • Build Skills Through Hands-On Learning

    Full-day workshops on October 25, October 26, and October 30 give attendees the opportunity to go deeper through guided, practical learning. You can add one, two, or three workshops to your conference pass and take advantage of onsite AI and agent certification opportunities designed to help you build practical skills and advance your career.

  • Connect, Collaborate, and Grow with the Community

    PPCC is more than a conference—it’s a place to meet people tackling similar challenges, learn from experienced practitioners, and discover ideas you can bring back to your organisation. Connect with experts in the Expo Hall, explore what makers are building in the Makers Market, meet community leaders in the Community Lounge, and continue conversations through meetups, networking activities, and the Night Market.

  • Experience the Conference Beyond the Sessions

    On Wednesday, October 28, 2026, attendees can turn up the energy at an exclusive celebration featuring a live performance by Pitbull. Don’t just watch the next era of AI-powered solution building take shape—come to PPCC and help shape it.

  • Mark Your Calendar for PPCC 2026

    The conference will be held on October 27-29, 2026 at the MGM Grand in Las Vegas.

Discover how we used Microsoft Power Platform to help the New Zealand Police Association (NZPA) deliver more services to its members. Read the case study and get in touch with our team to explore what’s possible for your organisation.
Build More Powerful Power Pages Experiences with Liquid Server Logic

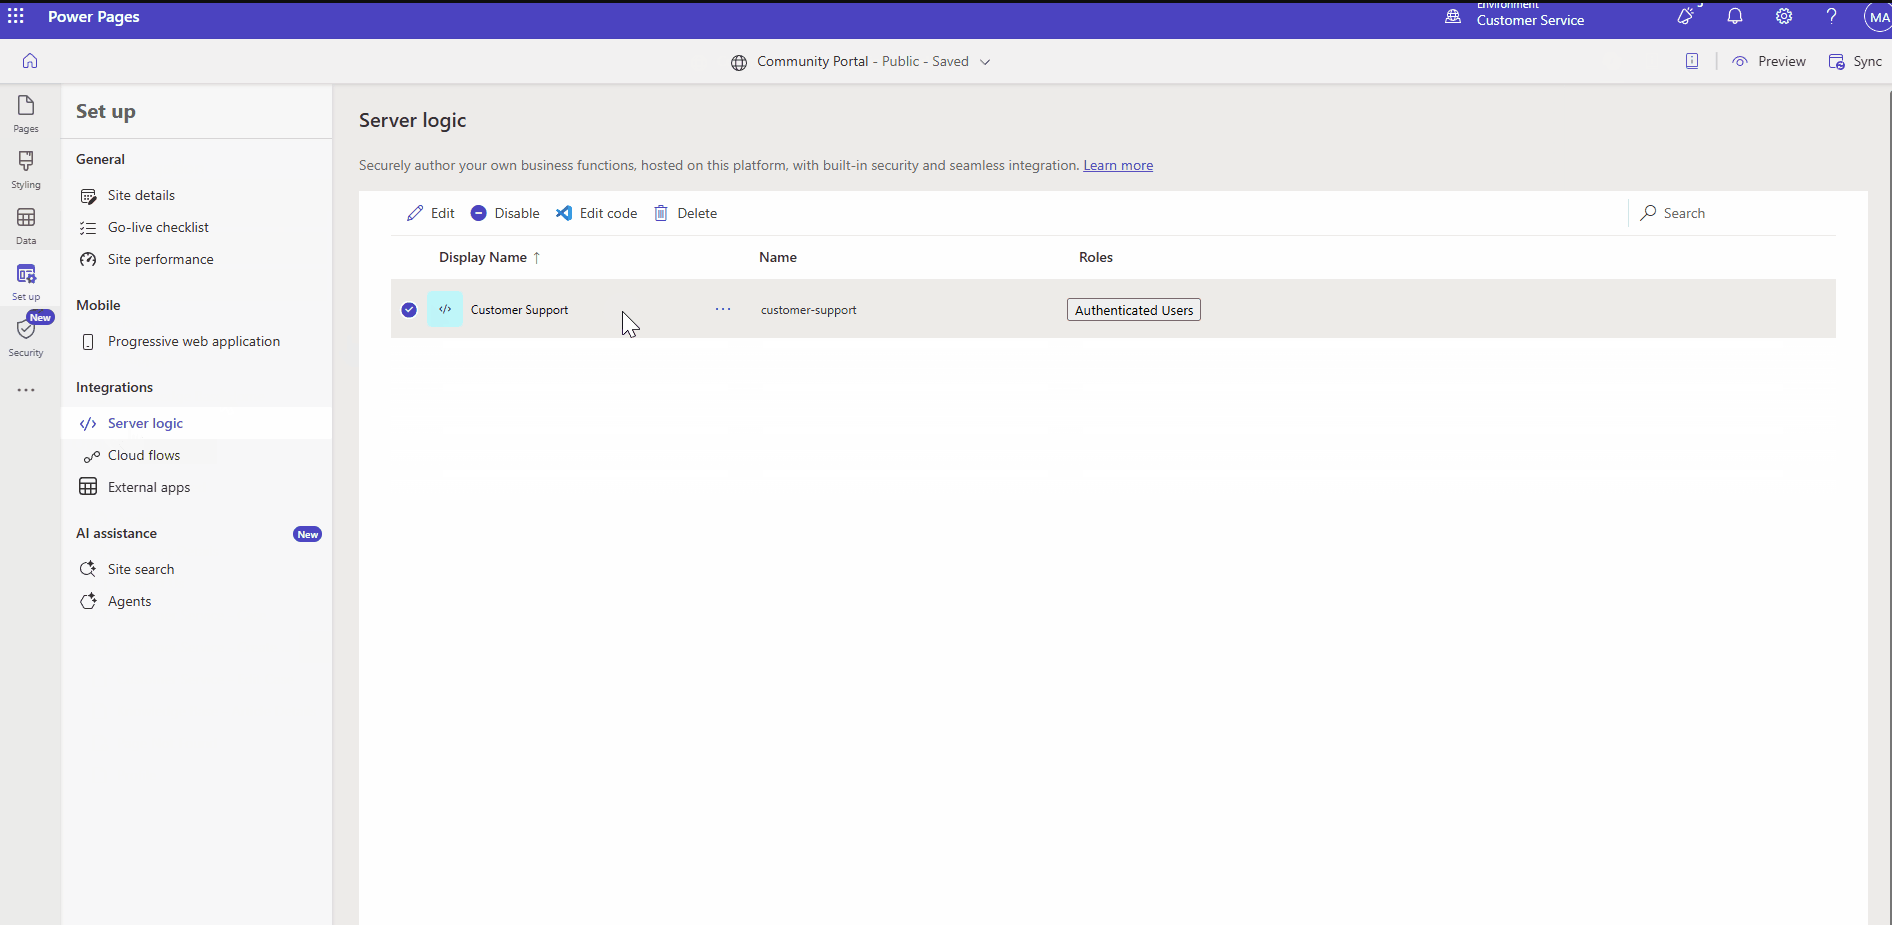
Microsoft is expanding the capabilities of Liquid in Power Pages with the introduction of server logic, giving developers more flexibility when building custom web experiences. The new capability allows developers to extend Liquid beyond the predefined platform-provided objects and bring additional server-side functionality into their Power Pages solutions.

Here's what you need to know:

  • Your Struggle

    Liquid provides powerful capabilities in Power Pages, but developers have often needed to adapt their requirements to available objects or move custom logic to other layers.

  • Bring Your Logic to Liquid

    With Server Logic, you can invoke your own server-backed capabilities directly from Liquid templates, extending what you can accomplish beyond built-in Liquid objects. Your logic runs securely on the server and can work with request and website context alongside Power Pages security capabilities.

  • Build More Dynamic Experiences

    Combine custom server logic with contextual information and Power Pages security to create more dynamic experiences while maintaining consistent access control. This gives developers greater flexibility without compromising how business logic is securely handled.

  • Get Started

    Ready to extend what you can do with Liquid in Power Pages? Explore the Server Logic overview, learn how to call Server Logic from Liquid templates, and discover how server objects and context work together to start building.

See how we used Power Pages to enhance Human Resources New Zealand’s membership management system. Read the case study to discover the solution, and contact us to explore how we can help with your organisation’s digital needs.

Visual Studio 2026 Makes Git Submodules a First-Class IDE Feature

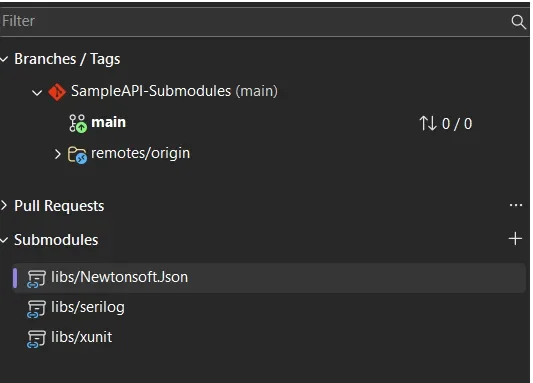
Starting with Visual Studio 18.9, Git submodules are becoming a first-class part of the IDE, allowing developers to manage them without leaving Visual Studio. The update addresses a long-requested developer need by bringing submodule management directly into the Git experience, making it easier to work with shared libraries, SDKs, and other dependencies.

Here’s what you need to know:

  • Your Struggle, Solved

    Git submodules are incredibly useful for bringing shared libraries, SDKs, and build scripts into your projects. But managing them has often meant leaving your IDE and remembering the right Git commands just to get things working.

  • A First-Class Git Experience

    Git submodules now have a dedicated Submodules section in the Git Repository window, making them much easier to discover and manage. They also appear properly in Git Changes, while branch and repository pickers understand the relationship between your parent repository and its submodules.

  • Manage Submodules Without the Terminal

    You can now add, update, and remove submodules directly from Visual Studio, without memorising Git commands or jumping between tools. Visual Studio can also automatically discover and activate submodules when you open a solution or folder, while keeping them out of the main local repositories list to reduce clutter.

  • Read-Only by Default

    Since submodules are often dependencies rather than code you actively modify, Visual Studio treats them as read-only by default to help prevent accidental changes. When you do need to work inside a submodule, simply enable Tools > Options > Source Control > Git > Automatically activate multiple repositories > Yes, include submodules.

Go beyond CRM with custom business applications designed to complement your existing system, streamline processes, and drive productivity. Contact us today to get started.

TMDL View on the Web: A New Way to Manage Power BI Semantic Models

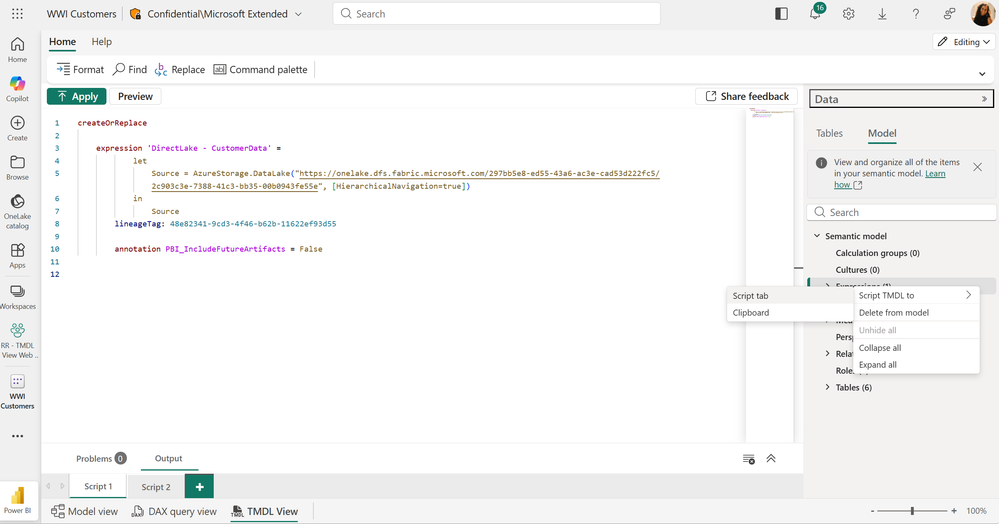
Microsoft has introduced TMDL View on the Web, bringing a code-first approach to editing Power BI semantic models directly in the browser. The new capability allows developers to view and modify semantic model definitions using Tabular Model Definition Language (TMDL), without needing to switch to Power BI Desktop or download model files.

Here’s what you need to know:

  • Explore Your Semantic Model Metadata

    Get greater visibility into the objects and properties within your published semantic models, including advanced settings that aren’t available in the standard modelling interface. Script individual objects directly in the browser to understand your model structure faster and work with greater transparency.

  • Accelerate Development with a Modern Code Editor

    Use built-in IntelliSense, multiline editing, search and replace, and other features to make bulk changes more efficiently. You can even use AI tools such as GitHub Copilot to help generate or modify TMDL scripts before previewing and applying them in Power BI.

  • Modify Semantic Model Properties Directly

    Edit objects and properties directly in your browser, including advanced configurations such as partition definitions and isAvailableInMdx. This gives developers greater control over semantic models without needing to download files or switch between tools.

  • Reuse and Share Model Components

    Share TMDL scripts to make semantic model objects easier to reuse across projects. For example, you can copy a Calendar table’s TMDL script from another model or a TMDL gallery, paste it into your target model, preview the changes, and apply them.

  • Recover Changes with Version History

    Make changes with greater confidence knowing that web-edited semantic models support version history. Save versions directly from TMDL View on the Web, review previous versions, and restore an earlier version when needed.

  • Get Started with TMDL View on the Web

    TMDL View on the Web brings a flexible, code-first approach to semantic modelling directly into the Power BI Service. Whether you’re making targeted metadata updates, reusing model components, or managing larger modelling changes, you can now work directly from your browser.

New to Power BI? Discover how Business Intelligence can transform your data into actionable insights and help you make smarter, data-driven decisions. Contact us today to get started!

New Power BI Date Picker Makes Dynamic Date Filtering Easier

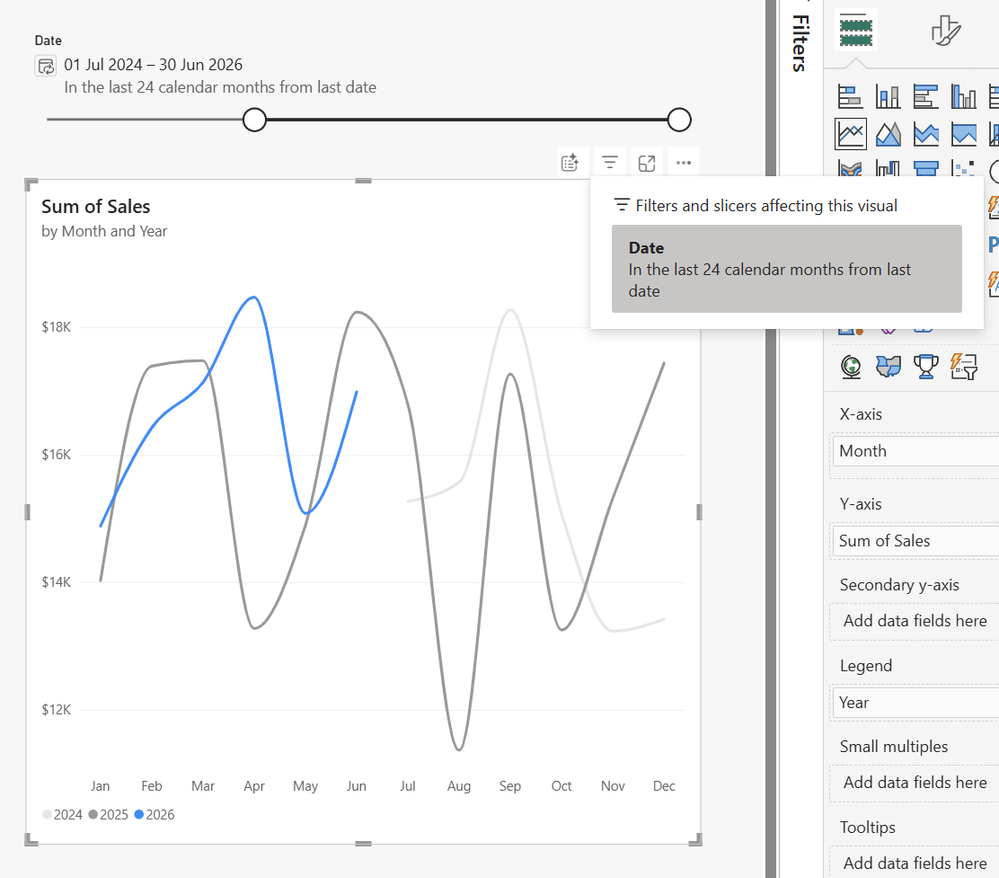
Microsoft has introduced a new Date Picker slicer option in Power BI, currently available in preview, designed to make date filtering more flexible and reduce the need for ongoing report maintenance. The new experience allows report authors to set dynamic date ranges that automatically move forward as data refreshes, while giving report viewers the flexibility to explore their own date ranges.

Here’s what you need to know:

  • See Exactly What You’re Filtering

    The Date Picker gives you two summaries so you can quickly understand both the dates being displayed and the range you selected. You can also customise the slider, calendar button, summaries, and date formatting to match your report design.

  • Enable the Date Picker

    You can enable the Date Picker through Visual > Slicer settings > Options in the Format pane when a date column is added to the slicer. During preview, Date Picker slicers can be created in Power BI Desktop, while published reports can be viewed and edited in the Power BI service.

  • Use Case #1: Show the Last Full Month

    Avoid misleading dips caused by displaying a partially completed month by using a relative date range that automatically moves forward as new data arrives. For example, you can configure the slicer to show the last 24 complete calendar months for more meaningful year-over-year comparisons.

  • Use Case #2: Handle Dates Beyond Your Data

    What happens when your date table extends into the future but your actual data doesn't? By applying a filter to your measure or column so that blank values are excluded, the Date Picker can dynamically align the range with the latest date where actual data exists.

  • Use Case #3: Create a More Compact Slicer

    You can customise the Date Picker to take up just a single line, giving your report more room for the visuals that matter. Turn off the slicer header and slider, adjust the summary and date range formatting, and use a calendar button for a clean, compact experience.

Make smarter decisions with data you can trust. Discover the power of Business Intelligence for your organisation and contact us today to get started.

Strengthen Customer Communications with Governance in Dynamics 365 Customer Service

Microsoft has announced the general availability of Governance in Dynamics 365 Customer Service, introducing new capabilities to help organisations enforce business policies on outbound customer communications. The update enables businesses to strengthen compliance and reduce risk while maintaining consistent customer interactions.

Here's what you need to know:

  • Why use Governance Skill?

    Governance reviews outbound emails against your organisation's policies before they're sent to customers. It helps reduce compliance risks while maintaining consistent communication across both human and AI-generated responses.

  • What's New in General Availability?

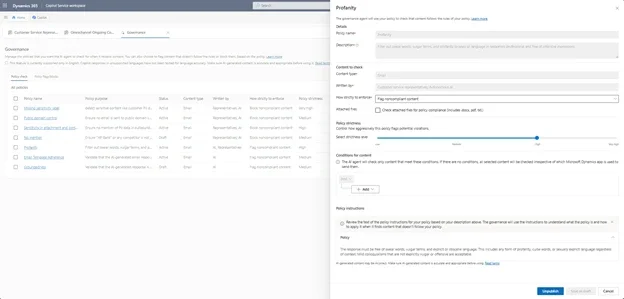
    Governance now checks text-based attachments such as PDFs, Word documents, and text files for policy compliance before they leave your organisation. You can also configure policy strictness levels—from Low to Very High—to balance business risk, accuracy, and enforcement.

  • Why Your Organisation Should Care

    Catch compliance issues before emails are delivered and strengthen trust in every customer interaction. With proactive governance controls, organisations can confidently scale AI while maintaining quality and regulatory standards.

  • Configure Governance Your Way

    Administrators can quickly configure governance policies, choose whether to flag or block violations, and enable attachment scanning. Built-in simulation and reporting tools make it easy to test and refine policies before rolling them out across the business.

  • Built into Dynamics 365 Customer Service

    Governance works alongside the Quality Evaluation Skill within the Quality Management Agent to deliver a complete quality and compliance framework. Together, they help organisations improve policy adherence, communication quality, and customer confidence at scale.

Strengthen customer relationships with a powerful Customer Relationship Management (CRM) system. Contact us today to discover how Dynamics 365 can help your business.

Create Smarter Geographic Reports with Power BI Shape Map

Power BI's Shape Map visual is now generally available, giving users a supported way to visualise data across custom geographic boundaries. The update introduces more flexibility for mapping regions, territories, and other location-based data while making geographic reporting easier to customise.

Here's what you need to know:

  • What is Shape Map?

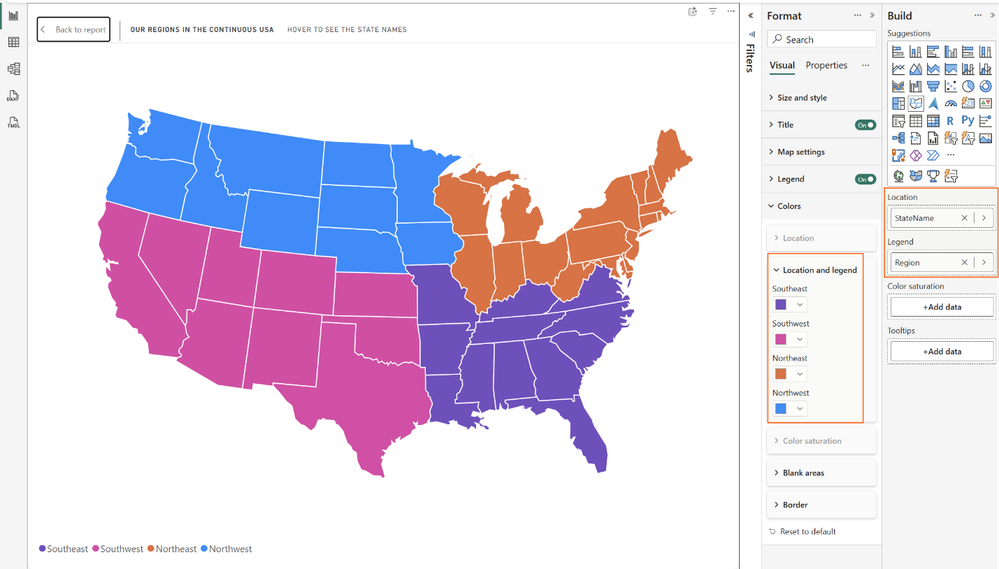
    Shape Map lets you display data using custom boundaries such as sales territories, franchise regions, or service areas instead of relying on standard maps. It helps you compare performance in the way your business is organised.

  • How do you add maps?

    Choose from built-in maps, upload your own TopoJSON or GeoJSON files, or reference map files hosted online. This gives you the flexibility to use standard regions or create maps tailored to your organisation.

  • How do you format map colours?

    Apply gradients, rules, field values, or category colours depending on how your Shape Map is configured. Power BI automatically shows only the formatting options relevant to your visual, making customisation much easier.

  • Use Case #1: Regional Performance

    Group locations into business regions and assign consistent colours to each territory. This makes it easy to compare performance across sales, service, or operational regions at a glance.

  • Use Case #2: Store Coverage

    Use colour saturation to highlight where your stores are located and how densely they are distributed. Darker regions can represent higher store counts, helping identify both strong coverage and expansion opportunities.

Take your reporting further with Power BI and our Business Intelligence expertise. Contact us today to learn how we can help your organisation get more from its data.

Power BI Tips: Enhance Line Charts with Conditional Formatting

Microsoft has released a new deep dive into Power BI's conditional formatting for lines and legends, helping report authors create more dynamic and visually meaningful charts. The guide explores practical techniques for using gradients, rules, and field-driven colours to make reports easier to interpret and maintain.

Here's what you need to know:

  • What is Conditional Formatting?

    Conditional formatting lets you dynamically control colours and other visual properties using rules, gradients, or field values. It also supports visual calculations, making it easier to create flexible, data-driven reports without constant manual updates.

  • Where Can You Use It?

    Conditional formatting now supports lines, legends, markers, and line segments across more chart types, including line, area, bar, column, combo, pie, donut, and funnel charts. This gives you greater control over how important insights are highlighted while keeping report designs consistent.

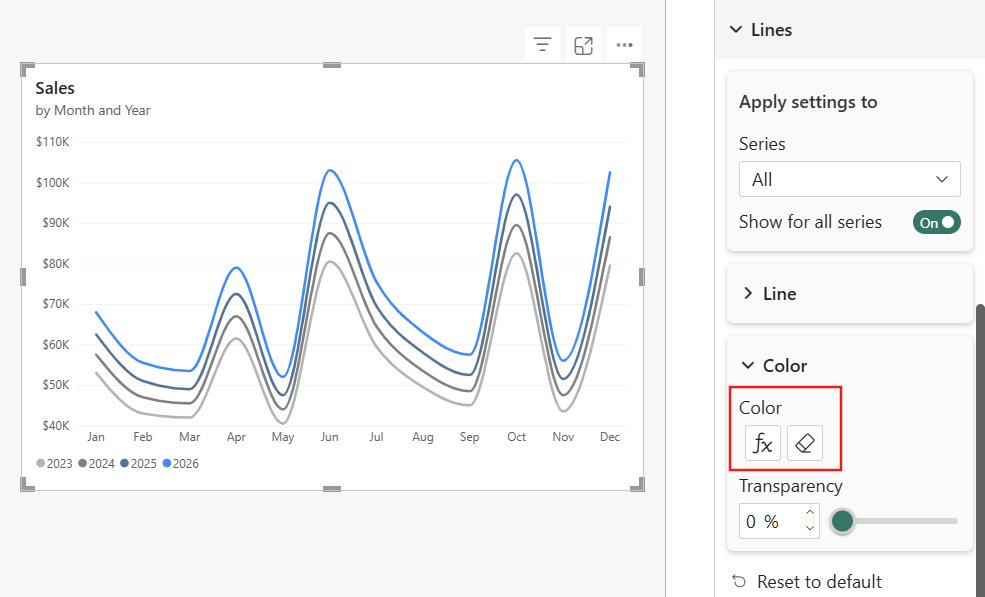
  • Use Case #1: Highlight the Latest Year

    Use gradient colours to automatically emphasise the most recent year's performance while fading historical data into the background. The formatting updates automatically as new data is added, so your reports always highlight the latest results.

  • Use Case #2: Keep Legend Colours Consistent

    Apply colours from a model field so every visual uses the same category colours throughout the report. This improves readability, reduces maintenance, and ensures new categories automatically inherit the correct colours.

  • Use Case #3: Pair Colours with Field Parameters

    Assign colours to field parameters so each selected measure keeps its own visual identity across every report. As users switch metrics, the colours update automatically, making comparisons easier to follow.

Discover how Sport Wellington gained valuable insights into participant performance with intuitive Power BI visualisations. Read the case study and contact us to discuss your business intelligence needs.

Power BI Modern Visual Defaults: Create Consistent Reports Faster

Power BI is making report design faster with a preview of modern visual defaults and improved theme customisation. The latest update helps authors apply consistent formatting across reports while reducing the time spent styling individual visuals.

Here's what you need to know:

  • Modern Visual Defaults

    Start with professionally styled visuals automatically on a new report page. Whether you're working with a local semantic model or a live connection, Power BI provides polished defaults so you can focus on your data rather than formatting.

  • Customise Your Entire Report Theme

    The new Customise Theme pane lets you update report-wide formatting from one place. Instantly preview changes to colours, fonts, visual properties, pages and filters without editing visuals individually.

  • Manage Themes with Ease

    Create, import, export or edit custom themes using JSON files and tools such as VS Code with Copilot. You can also switch base themes or preserve your preferred base theme when sharing reports.

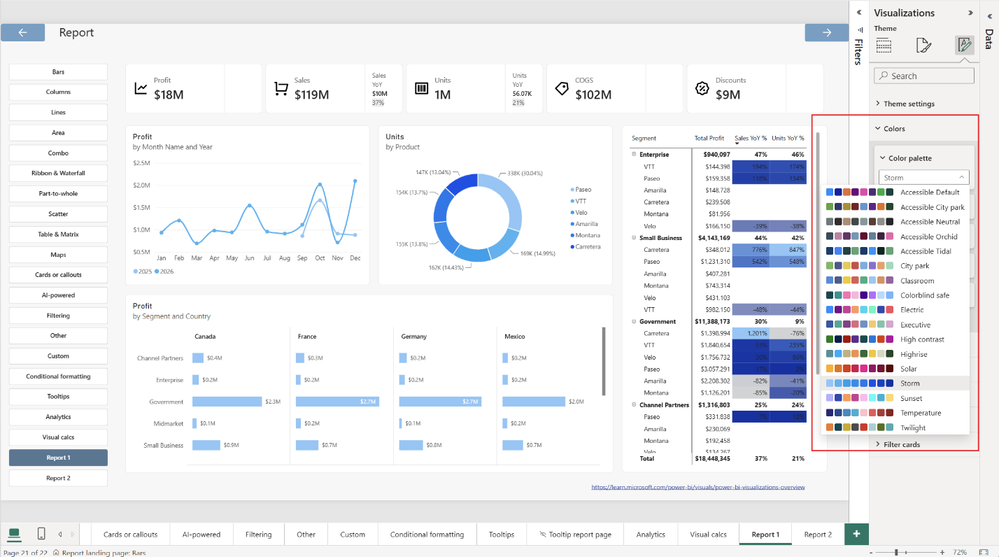
  • Apply Colour Palettes Instantly

    Mix and match built-in colour palettes with your existing themes or custom formatting. Adjust a colour once and every visual in your report updates automatically.

  • Standardise Text Formatting

    Set fonts, sizes and title styles across your entire report in just a few clicks. New visuals automatically inherit these settings, helping maintain a consistent and professional appearance.

  • Create Consistent Visuals

    Configure common visual properties such as backgrounds, borders, tooltips, shadows, headers and spacing from one central location. Achieve a clean, professional report design without repetitive formatting.

  • Set Default Page Formatting

    Define default page size, backgrounds, wallpaper and transparency for every report page. Existing pages can also be reset to adopt your new standard layout.

  • Format the Filter Pane Across Your Report

    Apply consistent styling to filter panes and filter cards across every page. This creates a more polished and consistent reporting experience.

  • Simplified Theme Selection

    The redesigned Themes menu makes it easier to distinguish complete report themes from simple colour palettes. You can confidently experiment with built-in undo support or quickly return to the default visual style.

See how the Independent Police Conduct Authority transformed complaint management with Power BI. Read the case study and contact us to discover how we can help your organisation turn data into actionable insights.

Dynamics 365 Customer Service Expands AI Integration with MCP Server GA

Microsoft has announced the general availability of the Dynamics 365 Customer Service MCP Server, making it easier for organisations to connect trusted customer service data with MCP-compatible AI clients. The release enables teams to access cases, knowledge, and customer context directly within the AI tools they already use, helping streamline workflows and improve decision-making.

Here's what you need to know:

  • What is the Customer Experience MCP Server?

    Customer Experience MCP Server uses the open Model Context Protocol (MCP) to securely connect AI applications with Dynamics 365 Customer Service. This standard approach eliminates the need to build separate integrations for every AI experience.

  • Why does it matter?

    Connections are managed through the Microsoft-hosted Agent 365 Tooling Gateway while respecting existing Dataverse security roles and permissions. This allows organisations to securely access Customer Service capabilities from multiple AI clients without compromising governance.

  • What can you do with it?

    More than 90 service tools are available out of the box, covering case management, customer context, knowledge, email, recommendations, Dataverse search, and administration. Teams can complete end-to-end service tasks, from finding information to resolving customer cases, without leaving their AI workflow.

  • Can it be extended?

    Organisations can connect external MCP servers, integrate Copilot Studio agents, and customise the experience to match their business processes. This flexibility allows your AI ecosystem to grow without replacing existing investments.

  • How do you get started?

    The Customer Experience MCP Server for Service is available now and can be connected through the Agent 365 Tooling Gateway. Microsoft provides setup guidance, supported client information, and authentication documentation to help you get up and running.

Bring more AI into your CRM with intelligent agents built to support your team. Explore Infinity AI Agents and contact us today to get started.