
Microsoft has announced the general availability of Visual Calculations in Power BI, allowing users to write DAX calculations directly within individual visuals. The feature simplifies report creation by keeping calculations close to where they're used, making it easier to build and customise visual insights.
Here's what you need to know:
Why should you use it?
Visual calculations let you create calculations that only apply to a specific visual, keeping your data model clean and easier to manage. This means you can build insights faster without creating additional report or model measures.
How it works
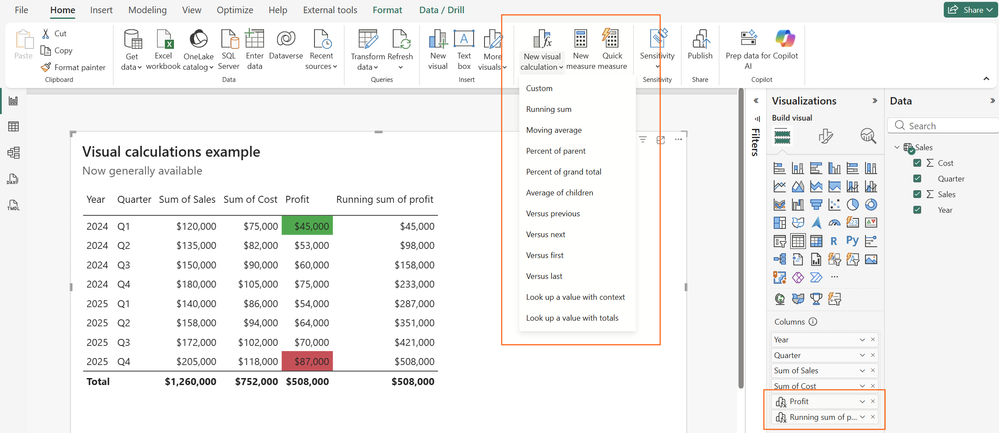
Create a visual calculation by selecting a visual and choosing New visual calculation from the ribbon, where you can write DAX and instantly preview the results. You can use familiar DAX functions, visual-specific functions like RUNNINGSUM and MOVINGAVERAGE, or built-in templates to speed up development.
Custom totals for tables and matrices
You can now customise how totals are calculated in tables and matrices by choosing options like Average, Count, Max, or even no total at all. This gives you greater control over how summary values are presented without writing additional DAX.
Example use cases
Visual calculations make it easy to create running totals, profit calculations, and conditional formatting directly within a chart or table. They're ideal for quick analysis without changing your underlying semantic model.
Where can you use it?
Visual calculations are available in both Power BI Desktop and the Power BI Service. They also work with embedded analytics, ensuring your calculations remain consistent wherever your reports are used.
Discover how the Independent Police Conduct Authority transformed complex data into clear, actionable insights with Power BI. Read the case study and contact us to see how we can help your organisation do the same.