
Power BI users can now provide richer context directly within their reports with the general availability of enhanced tooltip options for visuals. The latest update introduces more flexible ways to customise tooltips, making it easier to explain data and surface relevant information without building complex report pages or additional DAX measures.
Here's what you need to know:
Smarter Default Tooltips
Default tooltips automatically display the fields used in your visual, any additional tooltip fields, and supported drill actions. You can also customise the text, background, actions, and styling to match your report theme.
Show Only What Matters
Use Tooltip fields only to display only the information you've intentionally added to the Tooltip field well. This keeps hover details clean, focused, and relevant for your users.
Turn Data into Meaningful Insights
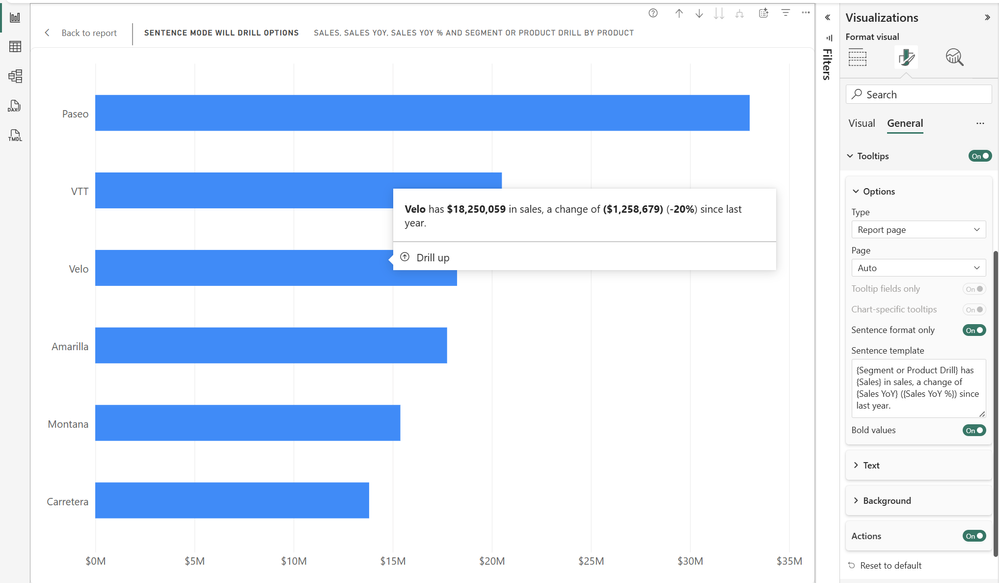
Sentence format lets you transform raw numbers into easy-to-read insights using dynamic field references like {Sales}. You can even display only the sentence for a cleaner, more conversational tooltip.
Dynamic Tooltips with Field Parameters
Tooltips automatically adapt when users switch between field parameters. Display both the selected field name and its corresponding value to keep insights accurate and contextual.
Tooltips That Follow Drill Hierarchies
Create tooltip sentences that update correctly as users drill through different hierarchy levels. This ensures the explanation always matches the data currently being viewed.
See the full list of Power BI tooltips.
Unlock deeper insights from your data with Power BI. Learn more about our Business Intelligence solutions and contact us today.