
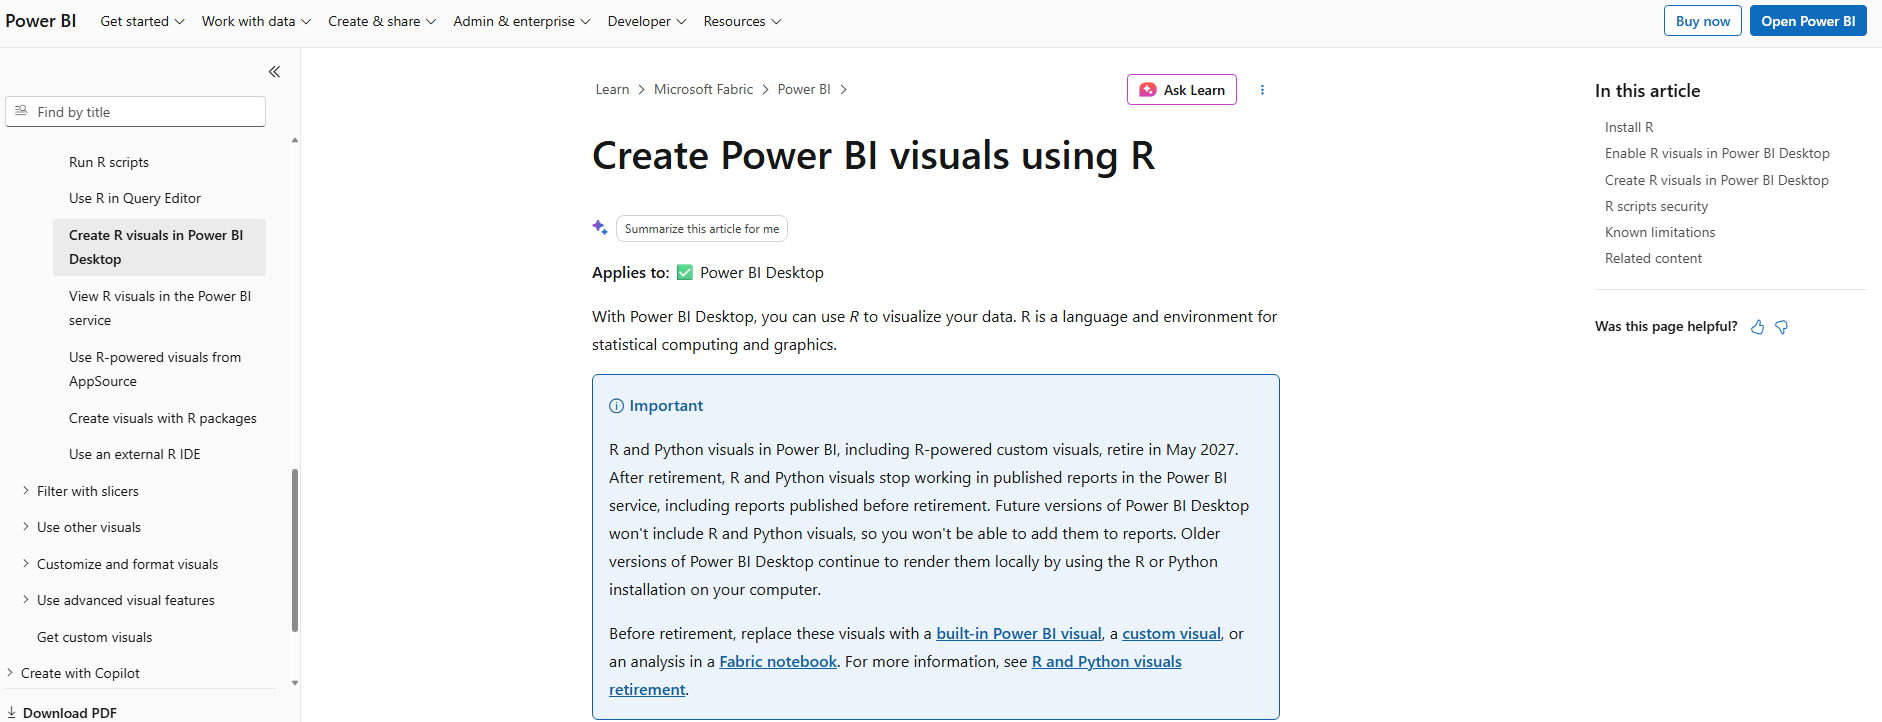
Microsoft has announced the upcoming retirement of built-in R and Python visuals in Power BI, scheduled for May 2027. This change will affect users who rely on these visuals to create data-driven reports and custom visualisations. Power BI users should start preparing for the transition and explore alternative ways to present their data.
Here's what you need to know:
What's Changing?
Microsoft is retiring built-in R and Python visuals in interactive Power BI reports by May 2027. This change also affects R-powered custom visuals, while Python scripts used in Power Query will remain unaffected.
What Do You Need to Do?
Review your existing reports to identify those using R and Python visuals before the retirement takes effect. Inform relevant teams and report owners, and preserve your existing scripts and dependencies for reference.
How Can You Replace These Visuals?
You can rebuild your visualisations using built-in Power BI visuals, existing custom visuals, or the Power BI Custom Visuals SDK. Alternatively, use Microsoft Fabric Notebooks or Fabric Apps to recreate analyses and visualisations outside Power BI reports.
What Are Your Next Steps?
Start testing your replacement visualisations and ensure they work as expected before May 2027. Keep report consumers informed about the changes and contact report owners if you use affected reports that you don't manage.
Discover how Power BI and Business Intelligence can help your organisation turn data into meaningful insights and make informed decisions. Explore our Business Intelligence solutions and contact us today to learn more!